Performance Analysis
Comprehensive Analysis Suite
At Station Trade Metrics Lab, we provide you with a powerful set of analysis tools designed to elevate your trading strategies to new heights. Our performance analysis suite is crafted to give you deep insights into your trading performance, helping you make data-driven decisions and optimize your approach.
Utilize our extensive range of features to evaluate and refine your trading strategies:
- Advanced Technical Indicators
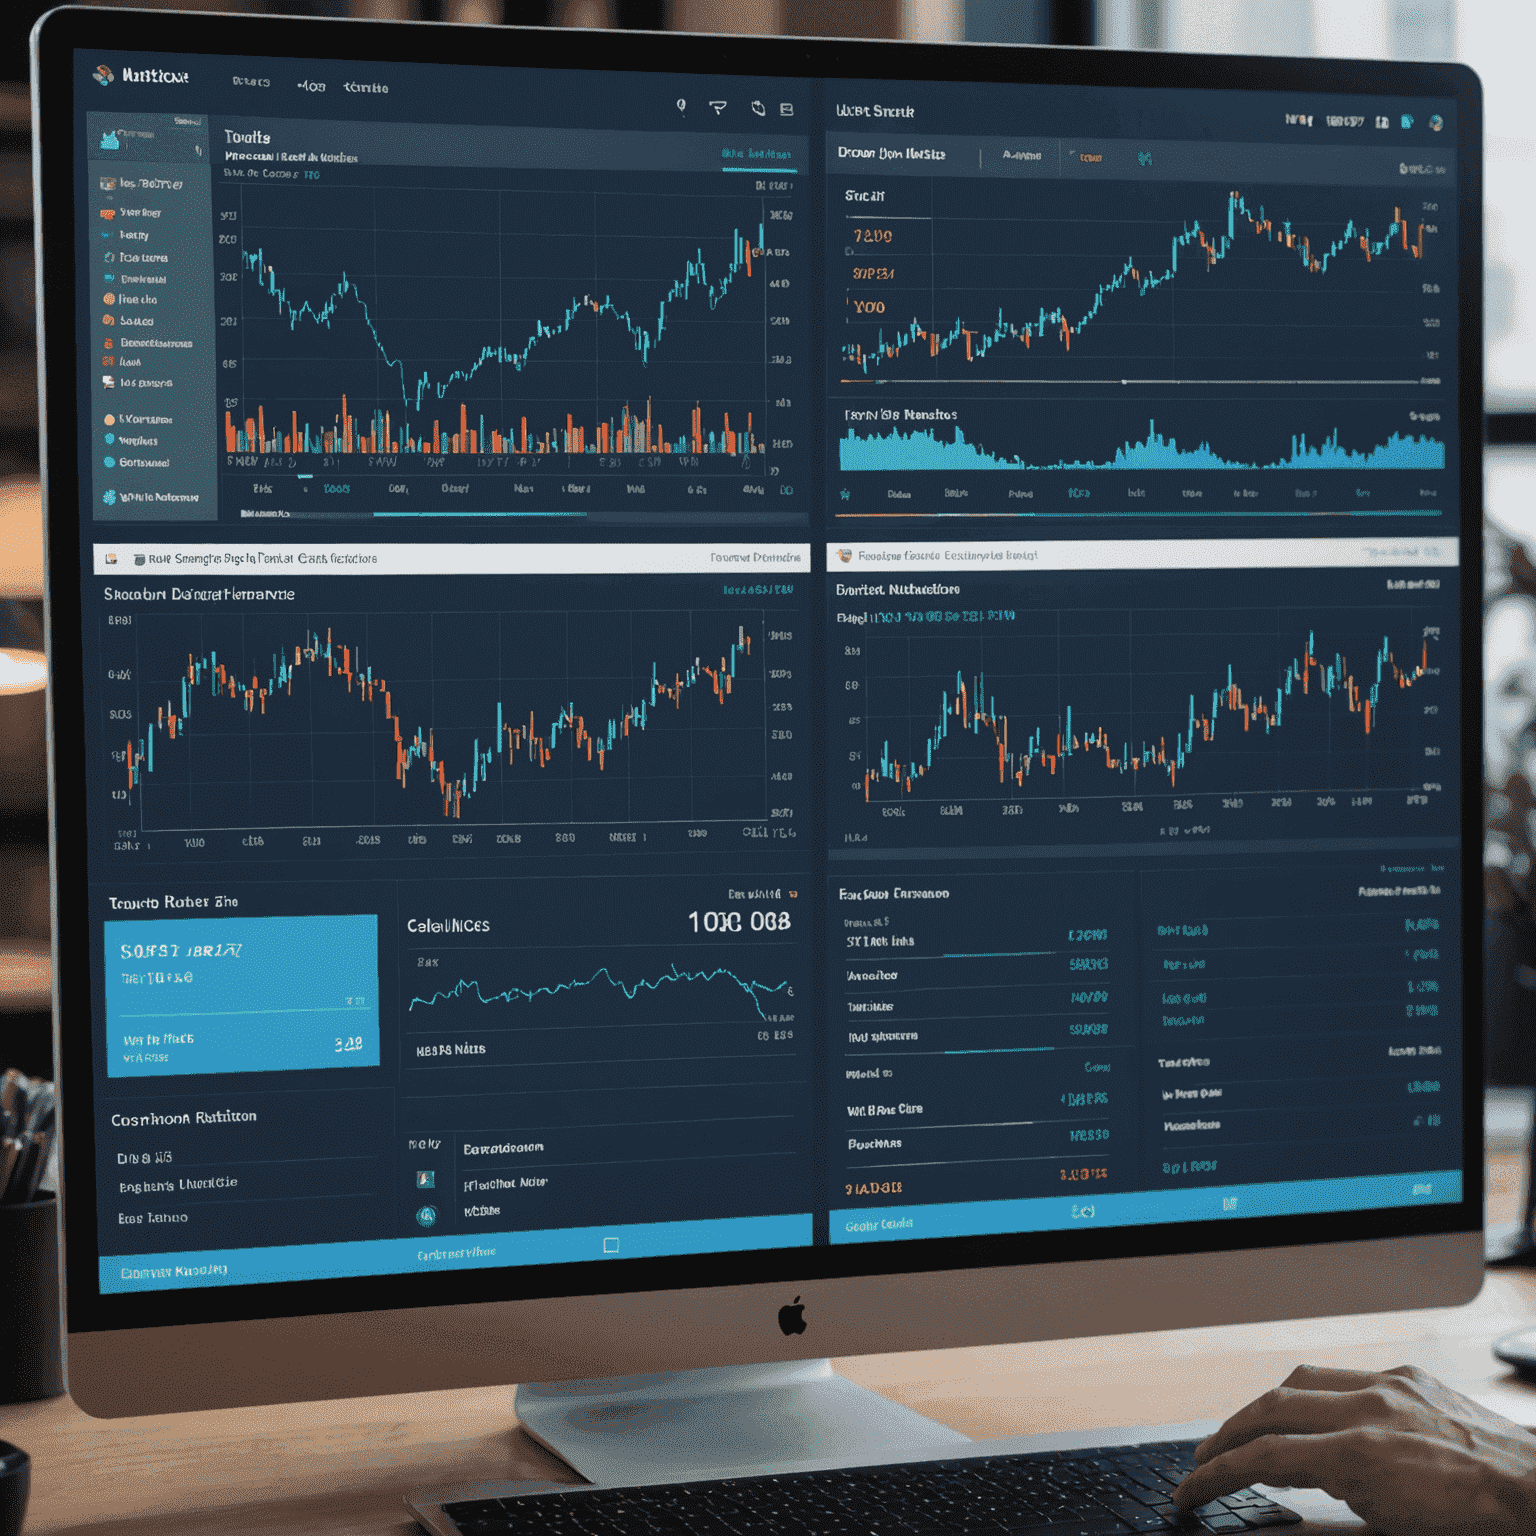
- Interactive Charts
- Flow Visualizations
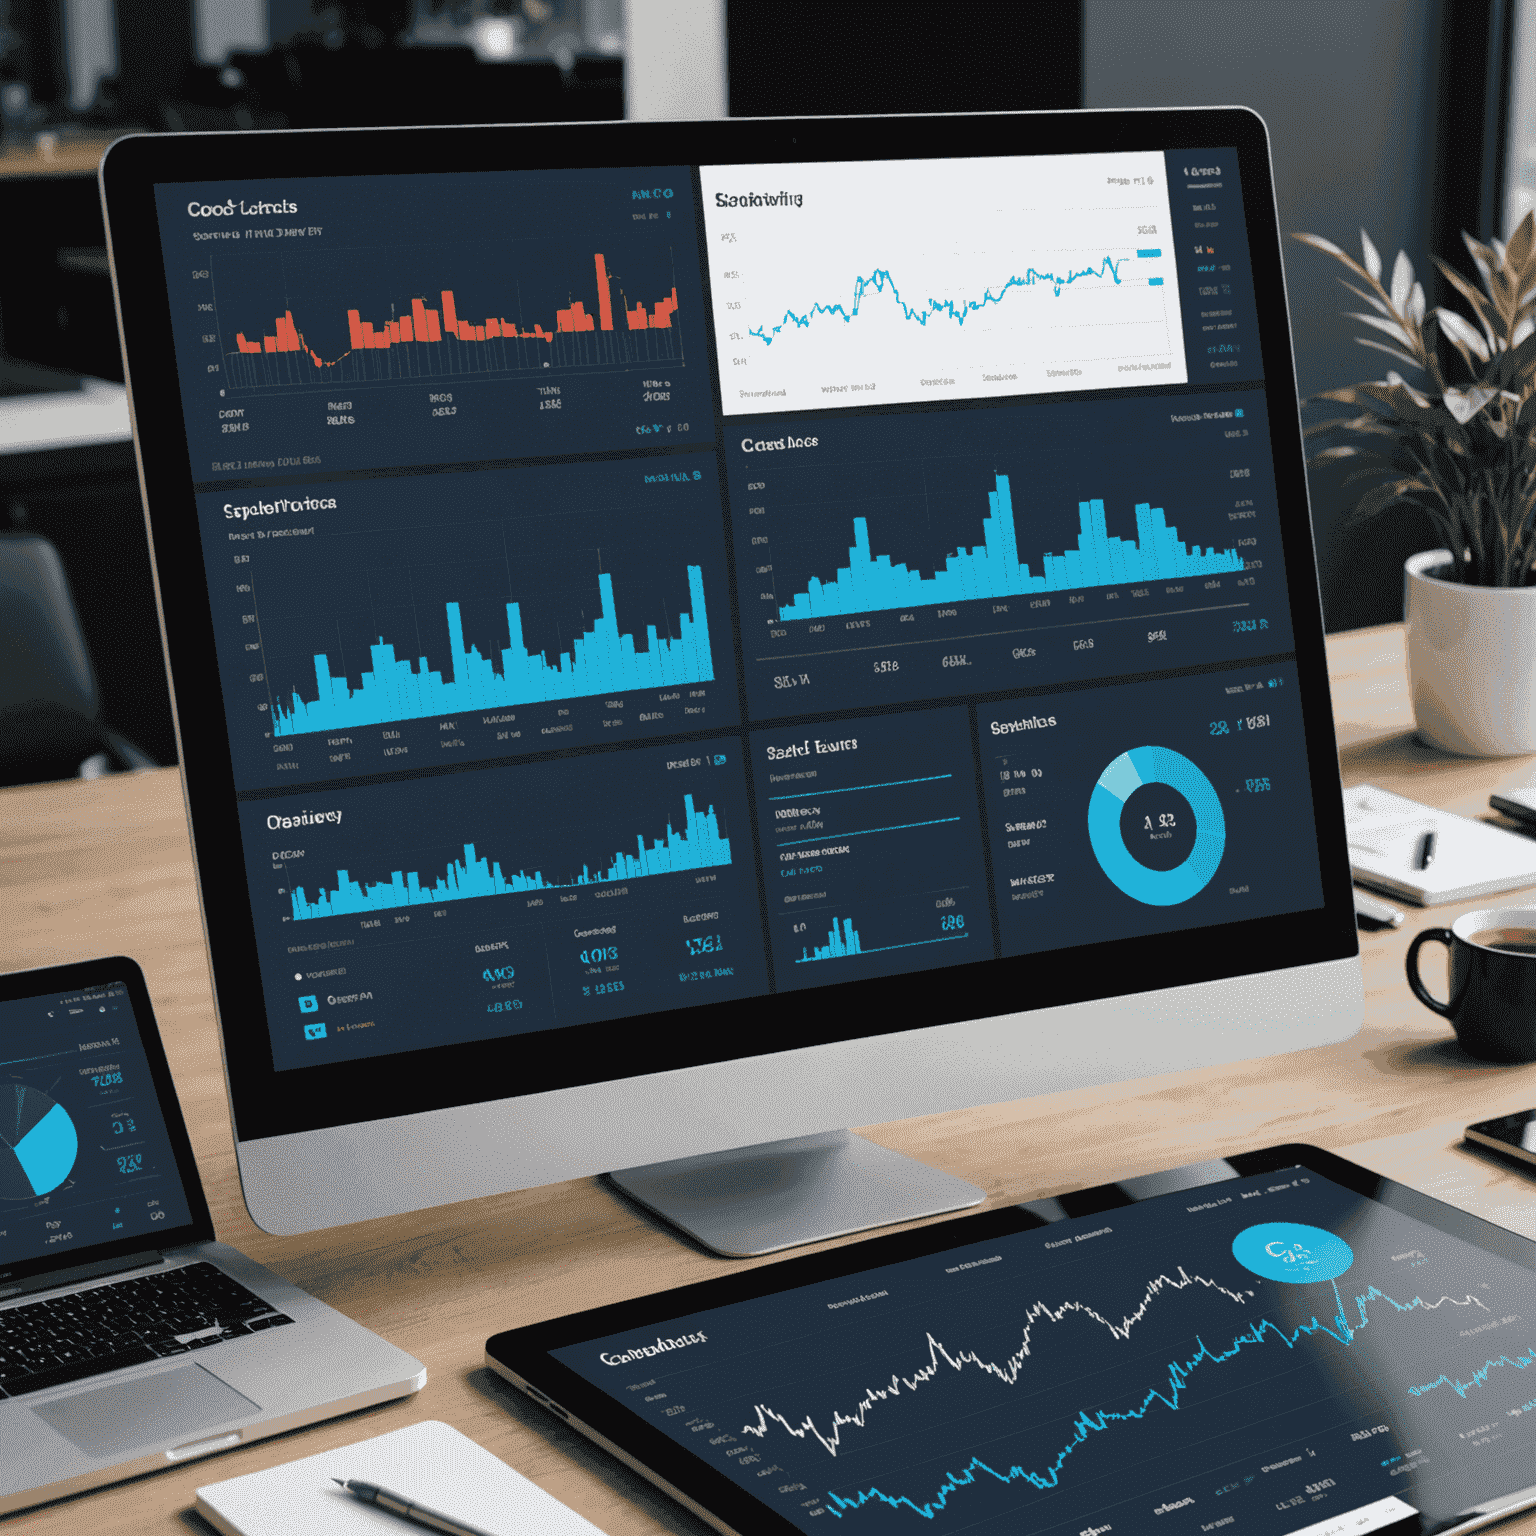
- Performance Metrics Dashboard
Technical Indicators
Access a wide array of technical indicators to analyze market trends and identify potential entry and exit points. Our platform supports popular indicators such as Moving Averages, RSI, MACD, and many more, allowing you to build a comprehensive technical strategy.
Interactive Charts
Visualize your trading data with our interactive charting tools. Customize your charts with multiple timeframes, overlay indicators, and drawing tools to gain a clear picture of market movements and your strategy's performance.
Flow Visualizations
Understand market dynamics better with our unique flow visualizations. These tools help you see the movement of capital, order flow, and market sentiment, giving you an edge in understanding complex market behaviors.
Strategy Optimization
Our performance analysis tools are designed to help you continuously improve your trading strategies. By providing detailed insights into your trading performance, you can:
- Identify strengths and weaknesses in your current approach
- Backtest strategies against historical data
- Analyze risk-reward ratios and optimize position sizing
- Track performance metrics over time to measure improvement
Elevate Your Trading with Data-Driven Insights
Whether you're a beginner looking to understand market dynamics or an experienced trader aiming to refine your strategies, our performance analysis tools provide the insights you need to succeed in the competitive world of trading. Leverage our comprehensive suite of analysis tools to evaluate, refine, and optimize your trading strategies for peak performance.